Spot on, Matthew. And if you’re not the kind of person who has Illustrator or Photoshop skills, there are a few answers for you.
But first off, if you’re looking for a really basic walkthrough on visualizations, the Cal-Berkeley j-school has a good tutorial. It’s all the basics — how to create charts, how to take stuff out of Google Docs and turn it into something visual. I really recommend it.
Okay, moving on: PIKTOCHART is a cool tool. They have a bunch of templates, and you just plug and play your data and images. With it, you can make an infographic in +/- 30 minutes. The only thing is, it’ll cost you — $29 per month. So that’s the trade off for a professional, online-based tool.
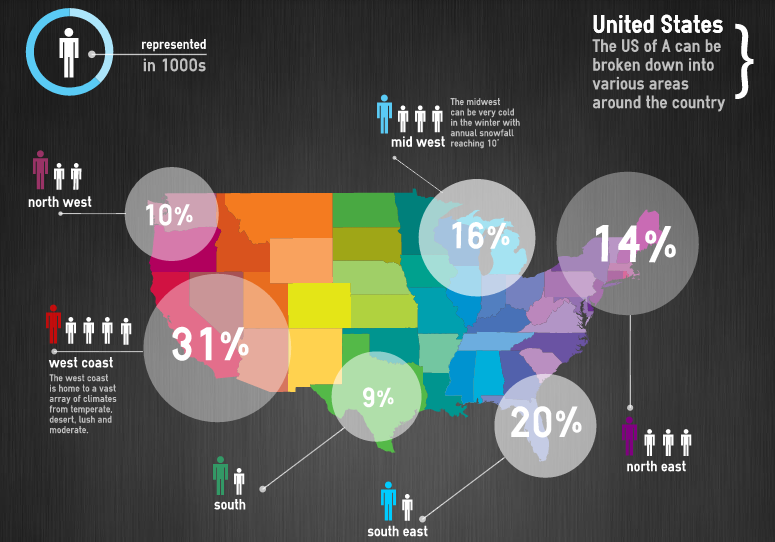
Now, there is a free tool out there, and it’s promising, but it’s in beta. It’s called Easel.ly. I’ve played with it a bit, and I like it so far. You start with a basic theme, then add objects (basically, more professional-looking clip art) to the templates. You can add your own text and images, too. It’s a little more time intensive than PIKTOCHART, but it’s got a lot of potential. Here’s an infographic built with the site:
Not bad, right? I’d recommend checking out some of the themes — that’ll give you an idea of what you can/cannot do with this tool.
Want to create something simple and social media related? Visual.ly is really cool, and dead simple to use. But it’s really limited to creating infographics that are Twitter/Facebook related. Check out their site for their examples. If you’re not interested in one of their small handful of templates, it won’t be much use to you.
Also worth checking out, if you’re a Windows user: Tableau. It’s really powerful, and it can take an Excel spreadsheet and make amazing stuff. Sadly, it’s only for Windows. But if you work on Windows, you should ABSOLUTELY check it out. It’s an amazing tool, and it can make pretty much anything. It’s what the pros use, and it’s free.
And if you’re looking just to make something really simple, don’t overthink it. Google has good tools for simple charts and graphs.
Oh, and one more thing: If you’re looking for infographic inspiration, start here.
Now get out there and tell some great stories today!