This week we have a user-friendly data viz tool, capable of producing beautiful charts and maps without the headache that comes with more feature-heavy tools like Tableau.
Datawrapper gives you the ability to put together graphics in just a few minutes. The free site has a variety of features, ranging from interactive graphics to tables that update live.
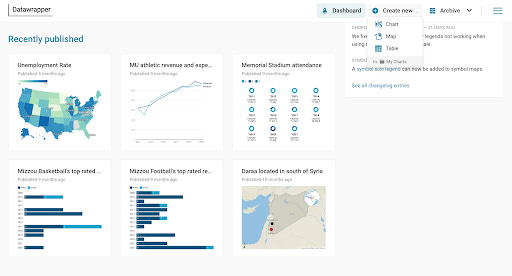
You can make choropleth, symbol or locator maps tied to datasets – and that’s just the maps section. Datawrapper gives you 19 different chart options just from linking a Google Sheet. This makes it more intuitive than some other data viz options, which can be intimidating in how to upload and format your source data.
In addition, graphics and tables can constantly update if linked to a web scraper or a spreadsheet you update separately. Get visualizing, reporters!
One more thing...
Did you miss the last TFR? Check out PAI’s guide to realistic AI tools you might want to use for your newsroom