I’ve seen them used for job hunts, electoral votes and even online dating data. The Sankey chart itself isn’t exactly new, but it’s kind of “trending” as far as visualizations go.
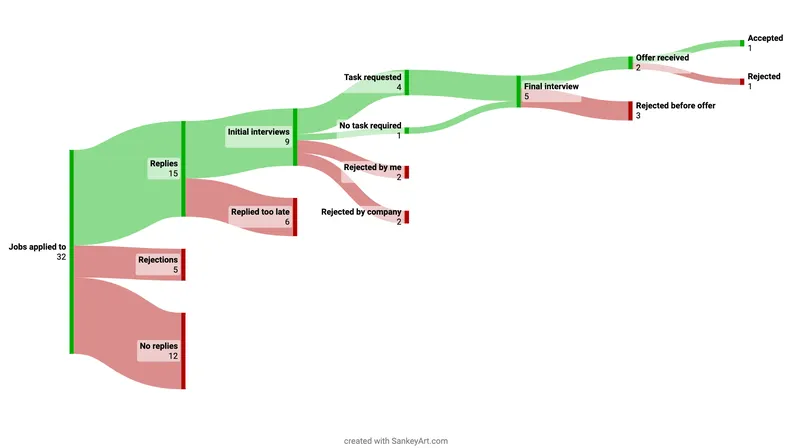
You can make them on a one-off site, like sankeyart.com, which made the one above. Or if you’re a tried-and-true data visualizer, you can use a broader tool like Flourish. I might recommend a rather simple one, with a single starting bar of data in the example above. Flourish’s more complex example might be a bit overwhelming to an audience member.
In any case, it’s an election year (yes I am going to be saying that a lot), so let’s all get accustomed to visualizing some data. Good luck, reporters!