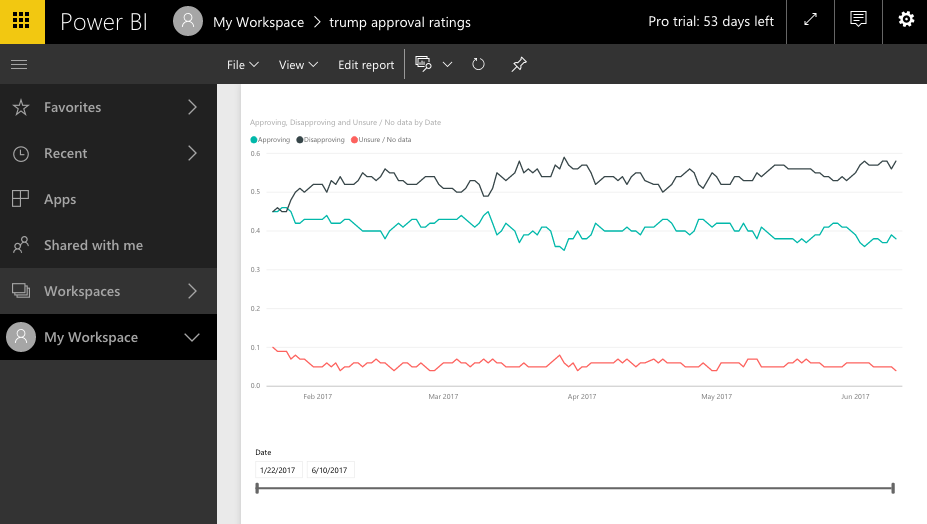
Like data dot world last week, Power BI prides itself on being a jack-of-all-trades for journalism: it gets data, imports it, analyzes it, visualizes it, even publishes it as interactive graphics. The difference is, Power BI is a Microsoft program and it’s more robust than a startup.
It’s mainly meant for Windows, but you can open a version on a web browser – and I suggest you do. (Heads up: you can’t sign up with a Gmail or Yahoo account – it needs to be at a domain, like email@courierjournal.com or whatever. But everybody’s got like 8 email addresses these days – I used my old IRE one.)
I could go into all the things Power BI can do, but it would take a while, so I suggest you take a look at Microsoft’s Data Journalism website. Suffice to say I was very impressed and may be using it at my IRE session this week. (Seriously, come say hi! 🙋 I swear I can talk about things other than data tools.)


